Fluids, Cores, and Flooding Procedures
The aqueous Cr(III)-acetate-HPAM gel used in this work contained 0.5% Alcoflood 935 HPAM (~5x10⁶ daltons, 5-10% degree of hydrolysis), 0.0417% Cr(III) acetate, 1% NaCl, and 0.1% CaCl2. The brine contained 1% NaCl and 0.1% CaCl2. The oil was hexadecane that was doped with either 10% iodohexadecane (used in Berea) or 15% bromohexadecane (used in polyethylene) to increase X-ray attenuation contrast relative to the brine phase. All experiments were performed at room temperature, except after gelant injection when the core was heated to ~60°C for 12 hours to induce gelation.
Wettability tests produced Amott-Harvey indexes4 of 0.7 for the brine/oil/Berea sandstone system and -0.8 for the brine/oil/porous polyethylene system—confirming the water-wet character of Berea sandstone and the oil-wet character of porous polyethylene.
The 6.5-mm diameter, 3-cm long cores were coated with a thin layer of epoxy and mounted with inlet and outlet fittings that allowed flooding between image acquisitions. The Berea core (specifically, the “first Berea core” discussed in Refs. 1-3) had a permeability of 0.47 darcys and a porosity of 22%. The polyethylene core had a permeability of 8.8 darcys and a porosity of 40%. Each core was initially saturated with wetting fluid (brine for Berea, oil for polyethylene). A vacuum was first applied to each core to ensure saturation. Subsequently, each core was subjected to drainage and imbibition displacements as listed in Table 1.
Table 1—Displacement sequence for each core.
| Residual saturation | Sor1 | Swr | Sor Sor2 |
Swr | Sor | ||
| Berea | brine | D | I | G | D | I | |
| Polythylene | oil | D | I | D | G | I | D |
All displacements were continued until residual conditions for the displaced fluid were achieved. Achievement of residual conditions was verified by monitoring the pressure drop and flow rate as the injection proceeded. The polyethylene core was subjected to two drainage displacements to bring it to residual oil before gelant injection. Gel placement was followed by a drainage-imbibition cycle to re-establish Swr and Sor conditions for computation of water and oil residual resistance factors. Residual resistance factors for a given phase (Frro for oil, Frrw for water) were determined by dividing the phase steady-state mobility before gel placement by the phase steady-state mobility after gel placement. XMT images were obtained after each flood. All floods and imaging were performed without removing the core from its mount on the imaging stage. Consequently, saturation changes were followed for individual pores throughout the flooding sequences.
Oil and water injection were performed at constant pressure gradients of 173 psi/ft in Berea and 35 psi/ft in polyethylene. Capillary numbers were around 6x10⁻⁵ in Berea and 2x10⁻⁴ in polyethylene. These capillary numbers are above the normal range for field-scale waterfloods and above the range where the residual non-wetting phase saturation is independent of capillary number. Lower capillary numbers would be preferred; our experimental choices were dictated by time limitations associated with the tomography procedures. Gelant injection occurred at 17 psi/ft in Berea and 23 psi/ft in polyethylene. At the flow rates used, the gelant solutions exhibited effective viscosities that were insensitive to fluid velocity.
Descriptions of ExxonMobil’s X2B tomographic imaging facility at Brookhaven National Laboratory are provided in Refs. 5-7. To avoid end effects, imaging was performed within a 6.5-mm diameter, 3.25-mm long segment of each core centrally located along its 30 mm length. Voxel resolution was 4.1 µm for the polyethylene core. The total imaged volume was 29.06 mm3, but image analysis on a workstation with 1 Gbyte RAM restricted analysis to a 450x450x475 voxel (6.63 mm3) region of each image. For Berea, the resolution was 4.93 µm, the imaged volume was 50.52 mm3, and the volume analyzed was 11.53 mm3 (450x450x475 voxels). Also, for details, see Seright, R.S., Prodanovic, M., and Lindquist, W.B.: “X-Ray Computed Microtomography Studies of Fluid Partitioning in Drainage and Imbibition Before and After Gel Placement: Disproportionate Permeability Reduction,” SPE Journal (June 2006) 159-170.
Table 2 summarizes the overall water saturations obtained in the analyzed region after each flooding step.
Table 2—Water saturation after various floods.
| Berea | Polyethylene | |
| @ Sor1 before gel | 86.0% | |
| @ Swr before gel | 16.0% | 16.5% |
| @ Sor or Sor2 | 81.6% | 83.0% |
| @ Gel placement | 63.7% | 99.8% |
| @ Swr after gel | 28.7% | 83.5% |
| @ Sor after gel | 49.0% | 99.7% |
Figure 4 compares the pore size distributions for Berea sandstone and porous polyethylene. The analyses examined 2,176 pores for the Berea sample and 1,879 pores for the polyethylene sample. The average pore size for polyethylene (0.00052 mm3) was 44% greater than that for Berea (0.00035 mm3). Interestingly, the median pore size was greater for Berea (0.00016 mm3) than for polyethylene (0.00010 mm3). The higher average for polyethylene occurred because it contained a larger fraction of pores with sizes greater than 0.002 mm3 (compare the high end of the distributions in Figure 4). Incidentally, if the pores were spherical (which they are not), the average pore radius would be 50 µm for polyethylene and 44 µm for Berea. For each flooding stage, the fluid phase saturations versus pore size were compared.
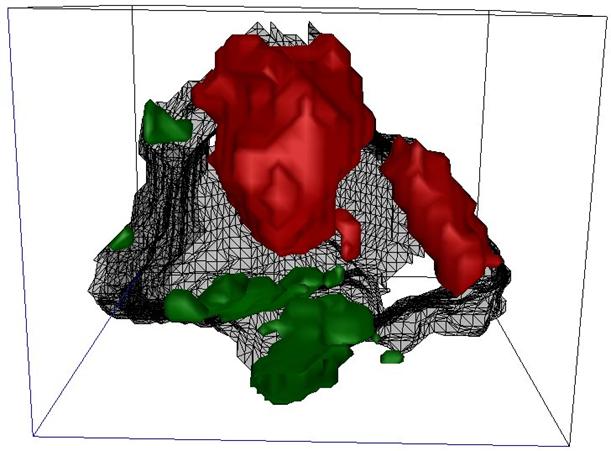
Figure 5 utilizes the ability to identify single pores and fluid blobs to examine changing fluid occupation within a single Berea pore. The grain surface of the pore is shown as a (partially transparent) gray mesh surface. The pore has coordination number 4, and the view into the pore is through one channel entrance. The red blobs show the position of oil within the pore at residual oil conditions (Sor before gel). The green blobs show the position of water in the pore at residudal water conditions (Swr before gel). The positioning of the blobs in this pore follows conventional wisdom—with the residual oil residing more in the pore center and residual water lying along the pore surface.