Imbibition and Drainage before Gel Placement
Comparison between drainage and imbibition in both porous media before gel placement provided an interesting insight into conventional wisdom.
Oil Drainage from Oil-Wet Polyethylene: Sw Values Were Consistent with Conventional Wisdom.
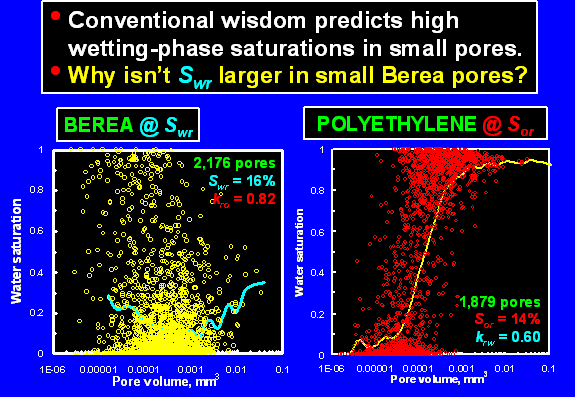
When a wetting phase drains from a porous medium, conventional wisdom argues that the smallest pores should retain the highest wetting-phase saturation. This expectation is consistent with our findings after water injection into (oil drainage from) oil-wet porous polyethylene (Figure 6). After the first drainage displacement (Sor1), oil saturation in the imaged region of the polyethylene core was 14%. Oil saturations at Sor are plotted in Figure 6 for each of the 1,879 pores in this region. The solid curve plots the average oil saturation as a function of pore size. As expected, the average oil (wetting phase) saturation in the smallest detected pores was more than 80% (Figure 6) while the medium to large pores were more likely to be filled with water.

During a second cycle of oil drainage (i.e., a second waterflood to drive the core to Sor2 after an intervening oil flood), most large pores again filled almost completely with water, while most small pores retained high oil saturations (Figure 7).

Oil Imbibition into Polyethylene: Oil Was Immobile in Small Polyethylene Pores.
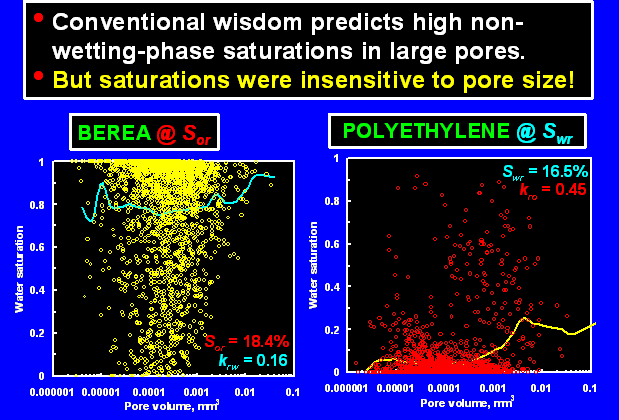
As mentioned, at Sor, most small pores had nearly 100% oil saturation, while most large pores had nearly 100% water saturation (Figure 6). When oil was injected to drive the core to Swr (Figure 8), water was displaced from most medium to large pores so that most pores ended with nearly 100% oil saturation. Thus, consistent with conventional wisdom, the wetting phase was largely immobile in small polyethylene pores.


Water Drainage from Berea: The Saturation Distribution Deviated from Conventional Wisdom.
In Berea sandstone, at connate water saturation (Swr) before gel placement, Sw in the imaged region was 16%. The water saturations at Swr are plotted in Figure 9 for each of the 2,176 pores in Berea. The solid curve plots the average water saturation as a function of pore size. At Swr, 54.5% of the pores had Sw< 5%; water saturations near zero were common for pores in most size ranges. The solid curve suggests that the average water saturation in the smallest detected pores was less than 60%. However, few pores existed at the small end of the distribution, so an average value may not be particularly representative. Even so, it is clear that water saturations in the smallest pores were scattered over the entire range from 0 to 100%—just as in most other size ranges.

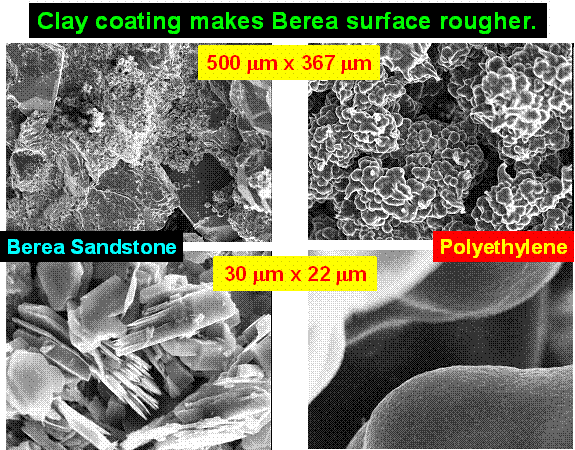
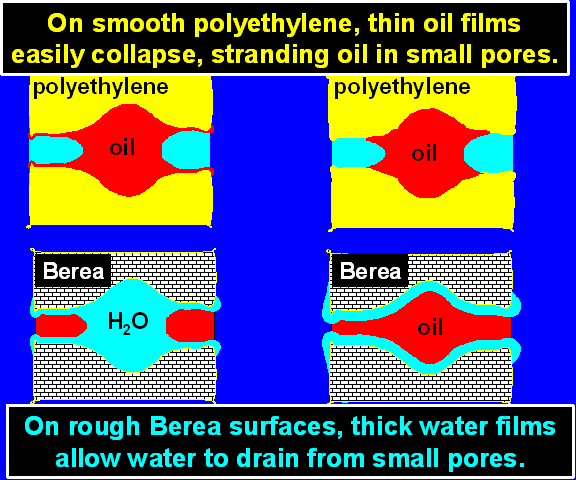
On first consideration, this finding appears to contradict the expectation that the water saturations approach 100% in the smallest pores of a water-wet porous medium. The work of Dullien et al.16 helps to explain the behavior that we see in Berea and why it deviates from that in polyethylene. Berea pores are typically coated with kaolinite that significantly increases the surface roughness of the pore walls. In contrast, the pore walls in polyethylene are quite smooth. (Scanning electron microscope images of the two samples are shown below.) At Sor, after oil drainage from the smooth polyethylene pore walls, an extremely thin (nanometer scale) oil film may have coated most pore walls (or possibly, no film may remain). At Swr in water-wet Berea, the rough clay coating made the effective thickness of the water film much greater than for any oil film in porous polyethylene. With a thicker effective wetting film, water drained fairly efficiently from the smallest detected Berea pores when oil was injected—thus allowing the smallest detected pores to reach water saturations comparable to those in larger pores (Figure 9). In contrast, when water was injected into porous polyethylene, oil usually became hydraulically isolated in the smallest detected pores because any remaining wetting film was too thin to efficiently drain oil. Consequently, high oil saturations were usually seen in the smallest detected polyethylene pores (Figures 6 and 7).


